Theglobal liability insurance carriers market was valued at USD 247.3 billion in 2023 and is expected to grow at a CAGR of 6.7% through 2029. This market plays a vital role in risk management, providing coverage for businesses and individuals against claims related to bodily injuries, property damage, and professional liabilities. The rising demand for liability insurance is fueled by technological advancements, evolving regulatory frameworks, and shifting consumer preferences.
Market Trends
Technological Innovations: AI, big data analytics, and blockchain are transforming risk assessment and claims processing.
Increasing Cyber Insurance Demand: With growing cybersecurity threats, businesses are prioritizing cyber liability coverage.
Focus on ESG Compliance: Sustainability and responsible business practices are influencing underwriting and investment decisions.
Climate-Related Insurance Solutions: Liability insurers are introducing products to address environmental risks and natural disasters.
Rising Demand for Commercial Coverage: Businesses are investing more in liability insurance due to increased litigation and operational risks.
The global liability insurance carriers market is expanding due to technological advancements, evolving business risks, and regulatory changes. As businesses and individuals seek robust liability coverage, insurers are focusing on innovation, sustainability, and tailored risk solutions to meet the dynamic demands of the industry.
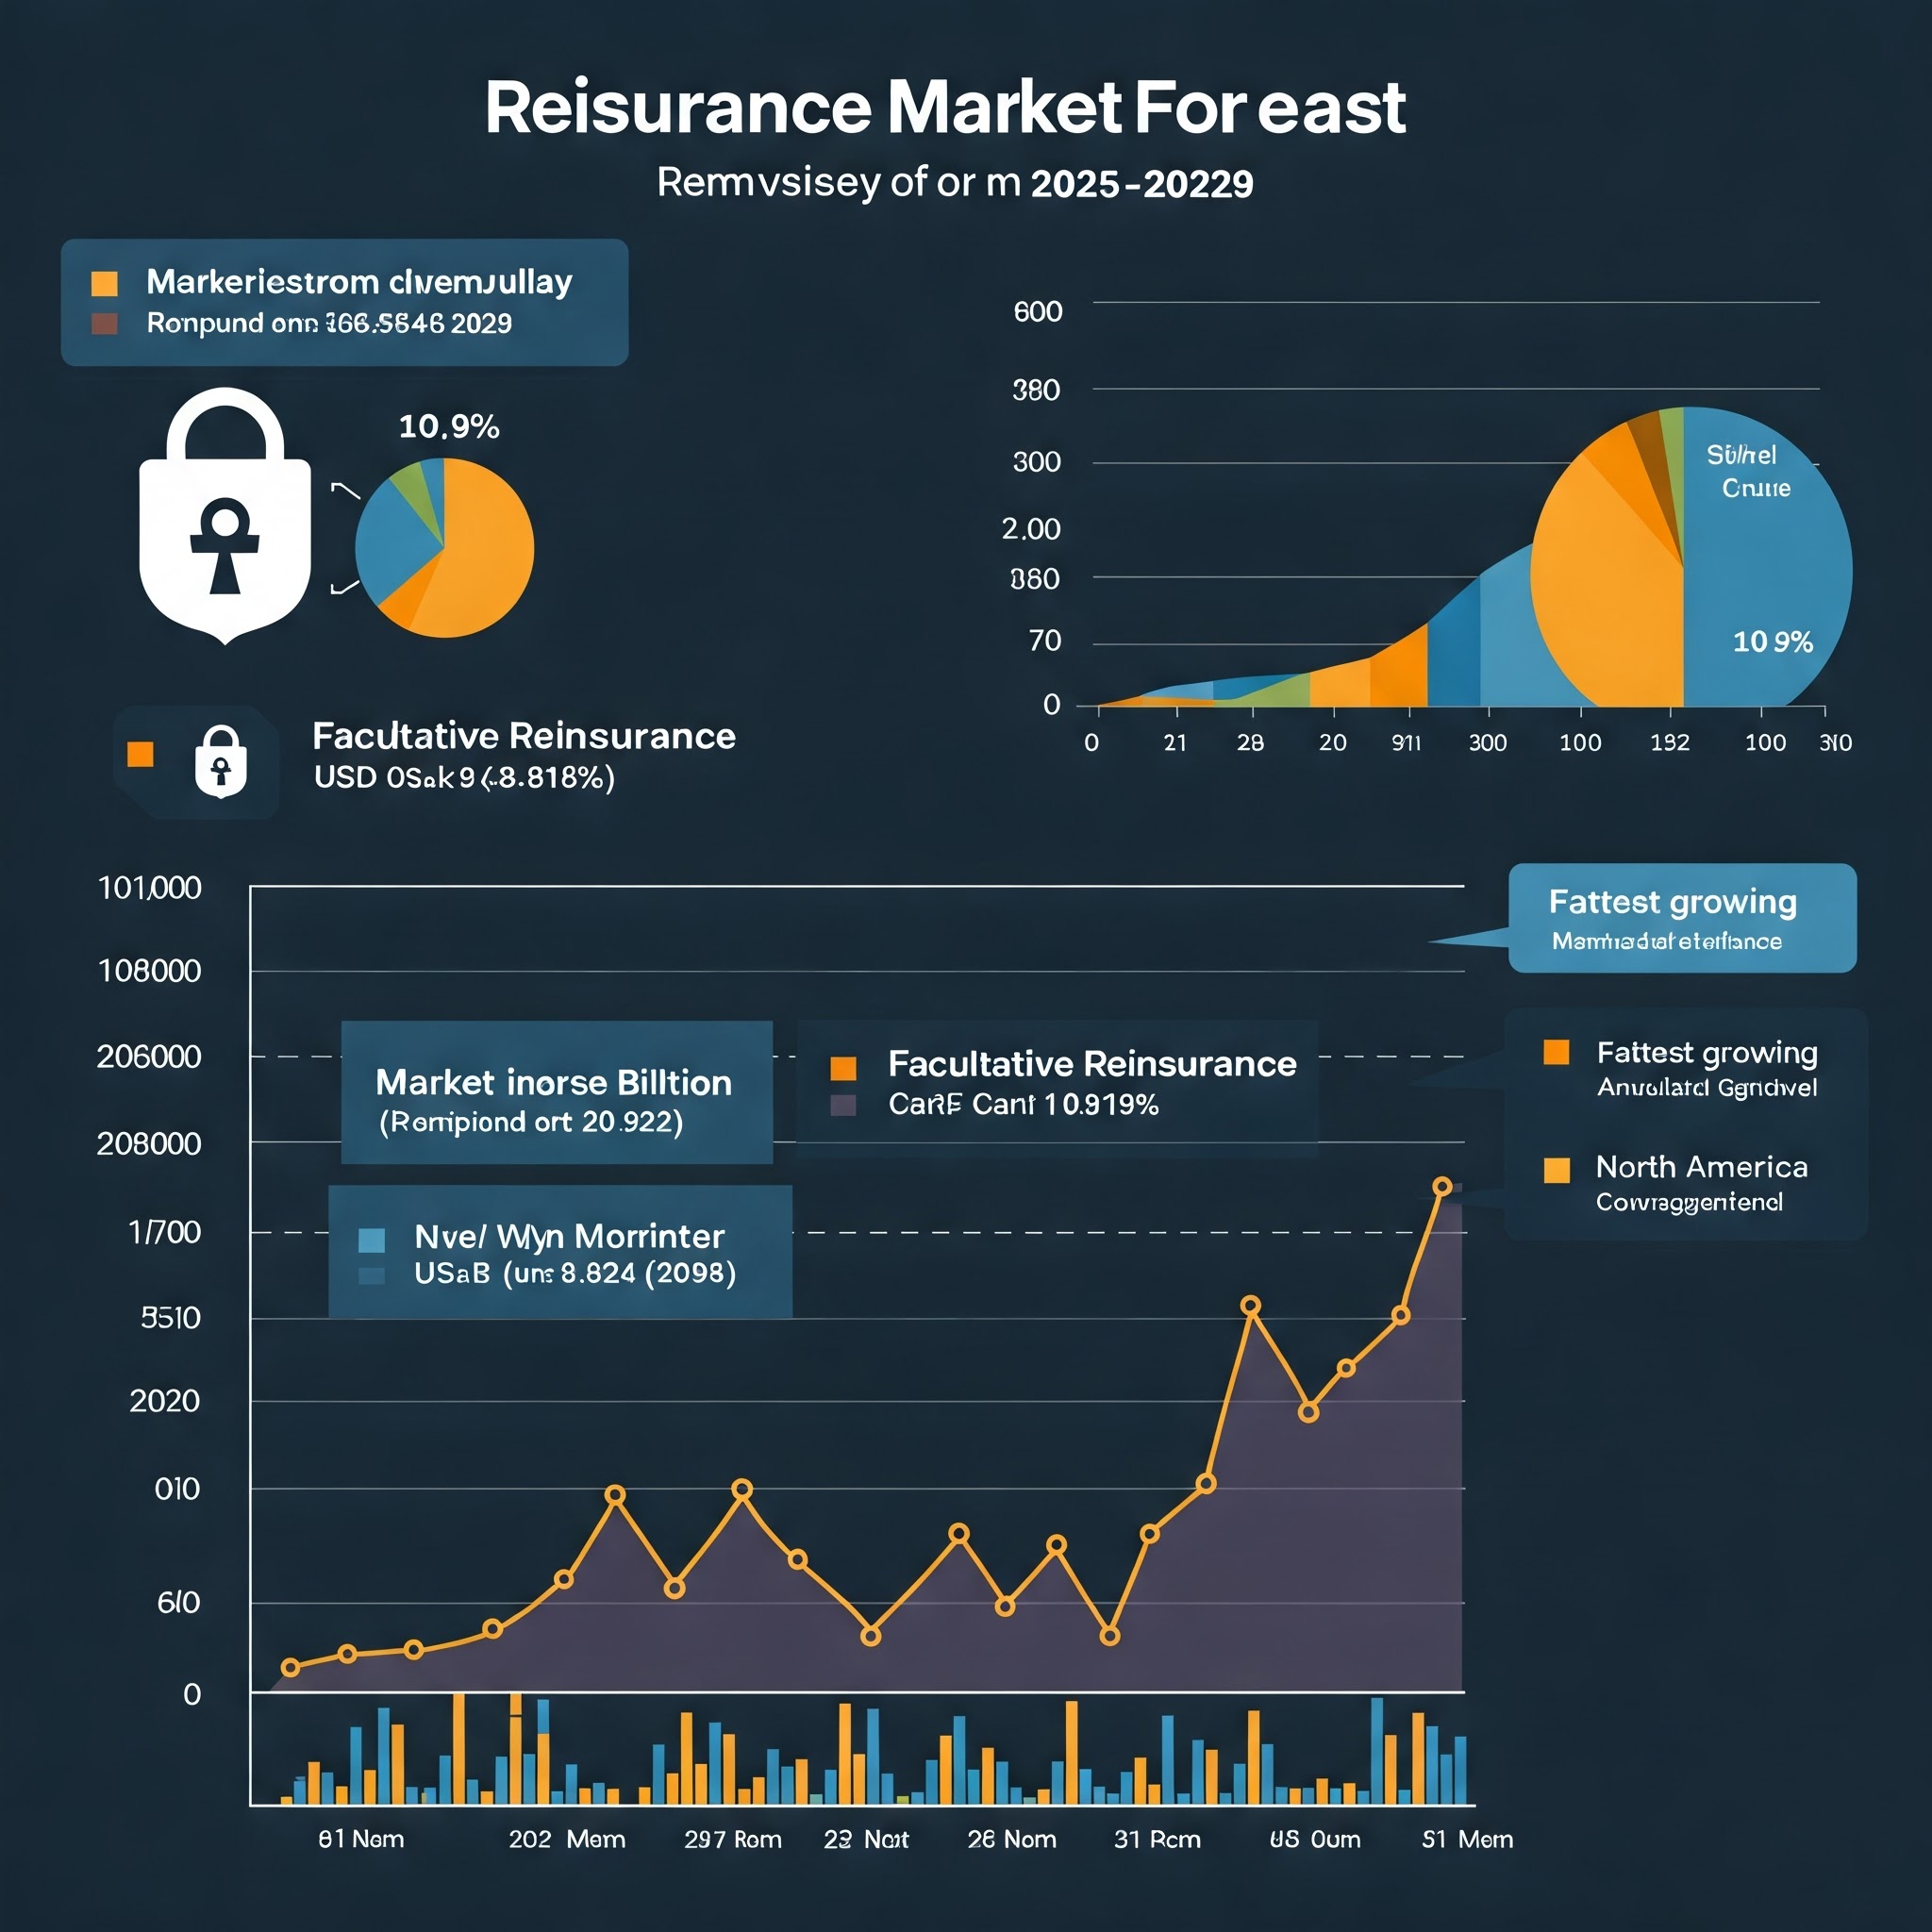
Theglobal reinsurance marketwas valued at USD 568.54 billion in 2023 and is expected to grow at a CAGR of 10.9% through 2029. This growth is fueled by advancements in data analytics, risk assessment technologies, and evolving consumer preferences. With increasing climate-related risks and complex insurance claims, reinsurance has become a crucial component for insurers looking to mitigate financial exposure and enhance market stability.
Market Trends
Technological Advancements: The integration of artificial intelligence (AI), big data analytics, and machine learning is transforming risk assessment and pricing models, improving underwriting efficiency.
Rising Cyber Insurance Demand: With growing cyber threats, reinsurers are expanding their offerings in this segment, developing innovative coverage solutions.
Alternative Capital Influx: The rise of insurance-linked securities (ILS) and catastrophe bonds has increased competition and changed market dynamics.
Environmental, Social, and Governance (ESG) Compliance: Sustainability and responsible investment strategies are reshaping the market, with reinsurers adopting ESG-focused policies.
Strategic Collaborations: Companies are forming alliances with insurtech firms and other industry players to expand market presence and enhance risk-sharing mechanisms.
The global reinsurance market is experiencing robust growth driven by technological advancements, alternative capital inflows, and rising cyber insurance needs. The sector is set to evolve with strategic collaborations and digital transformation, ensuring sustainability and market resilience through 2029.
The global sukuk marketwas valued at USD 1021.6 billion in 2023 and is projected to grow at a CAGR of 12.6% from 2024 to 2029. As a key component of Islamic finance, sukuk—also known as Islamic bonds—comply with Sharia principles, prohibiting interest-based transactions and ensuring ethical investments. The rising demand for Sharia-compliant financial instruments and the increasing adoption of Islamic banking worldwide are fueling the growth of the sukuk market.
Market Trends
Green and Sustainable Sukuk: The rise of ESG investments is driving the issuance of green and sustainable sukuk to finance renewable energy, infrastructure, and eco-friendly projects.
Digitization & Blockchain Adoption: The integration of blockchain and digital platforms enhances transparency, security, and efficiency in sukuk issuance and trading.
Diverse Sukuk Structures: Innovations such as hybrid sukuk and structured sukuk products cater to evolving issuer and investor needs.
Cross-Border Sukuk Issuance: Governments and corporations are issuing sukuk globally, expanding the investor base and integrating Islamic finance with mainstream financial systems.
Islamic Fintech Growth: The development of Islamic fintech platforms is simplifying sukuk investments, making them more accessible to global investors.
The sukuk market is expanding rapidly with strong regulatory support, technological innovations, and increasing global adoption. With a CAGR of 12.6% through 2029, sukuk is set to play a crucial role in shaping the future of Islamic finance and ethical investing.
Meta Description:
Discover key trends, growth forecasts, and insights into the global sukuk market, expected to expand significantly through 2029.
Tags:
Sukuk Market, Islamic Finance, Sharia-Compliant Bonds, Green Sukuk, ESG Investing, Digital Sukuk, Blockchain in Finance, Islamic Banking, Middle East Finance, Sustainable Finance, Financial Institutions, Cross-Border Investments, Hybrid Sukuk, Global Market Trends, Sovereign Sukuk, Islamic Fintech, Ethical Investing, Murabahah Sukuk, Ijarah Sukuk, Market Forecast
Theglobal livestock insurance market was valued at USD 3.21 billion in 2022 and is projected to grow at a CAGR of 7.65% from 2023 to 2028. As climate change, disease outbreaks, and market fluctuations pose risks to livestock farming, demand for commercial and non-commercial mortality insurance is rising. This market ensures financial protection for dairy farmers, cattle ranchers, and swine producers, securing their investments against unforeseen losses.
Market Trends
Climate-Driven Insurance Demand: Rising extreme weather events and disease outbreaks increase insurance adoption among livestock owners.
Digitalization & AI Integration: Use of satellite data, IoT tracking, and blockchain technology improves risk assessment and claims processing.
Growing Commercial Mortality Insurance: Large-scale livestock businesses are investing in comprehensive coverage against disease and market risks.
Government & International Support: Subsidized premiums and risk-sharing initiatives encourage insurance adoption in developing economies.
Expansion of Direct Sales Channels: Insurers are bypassing intermediaries, offering online policies and mobile-friendly claim services.
The livestock insurance market is evolving with advanced digital tools, government-backed subsidies, and customized policies. With a CAGR of 7.65% through 2028, insurers are focusing on climate resilience, efficient claims processing, and financial security for livestock owners worldwide.
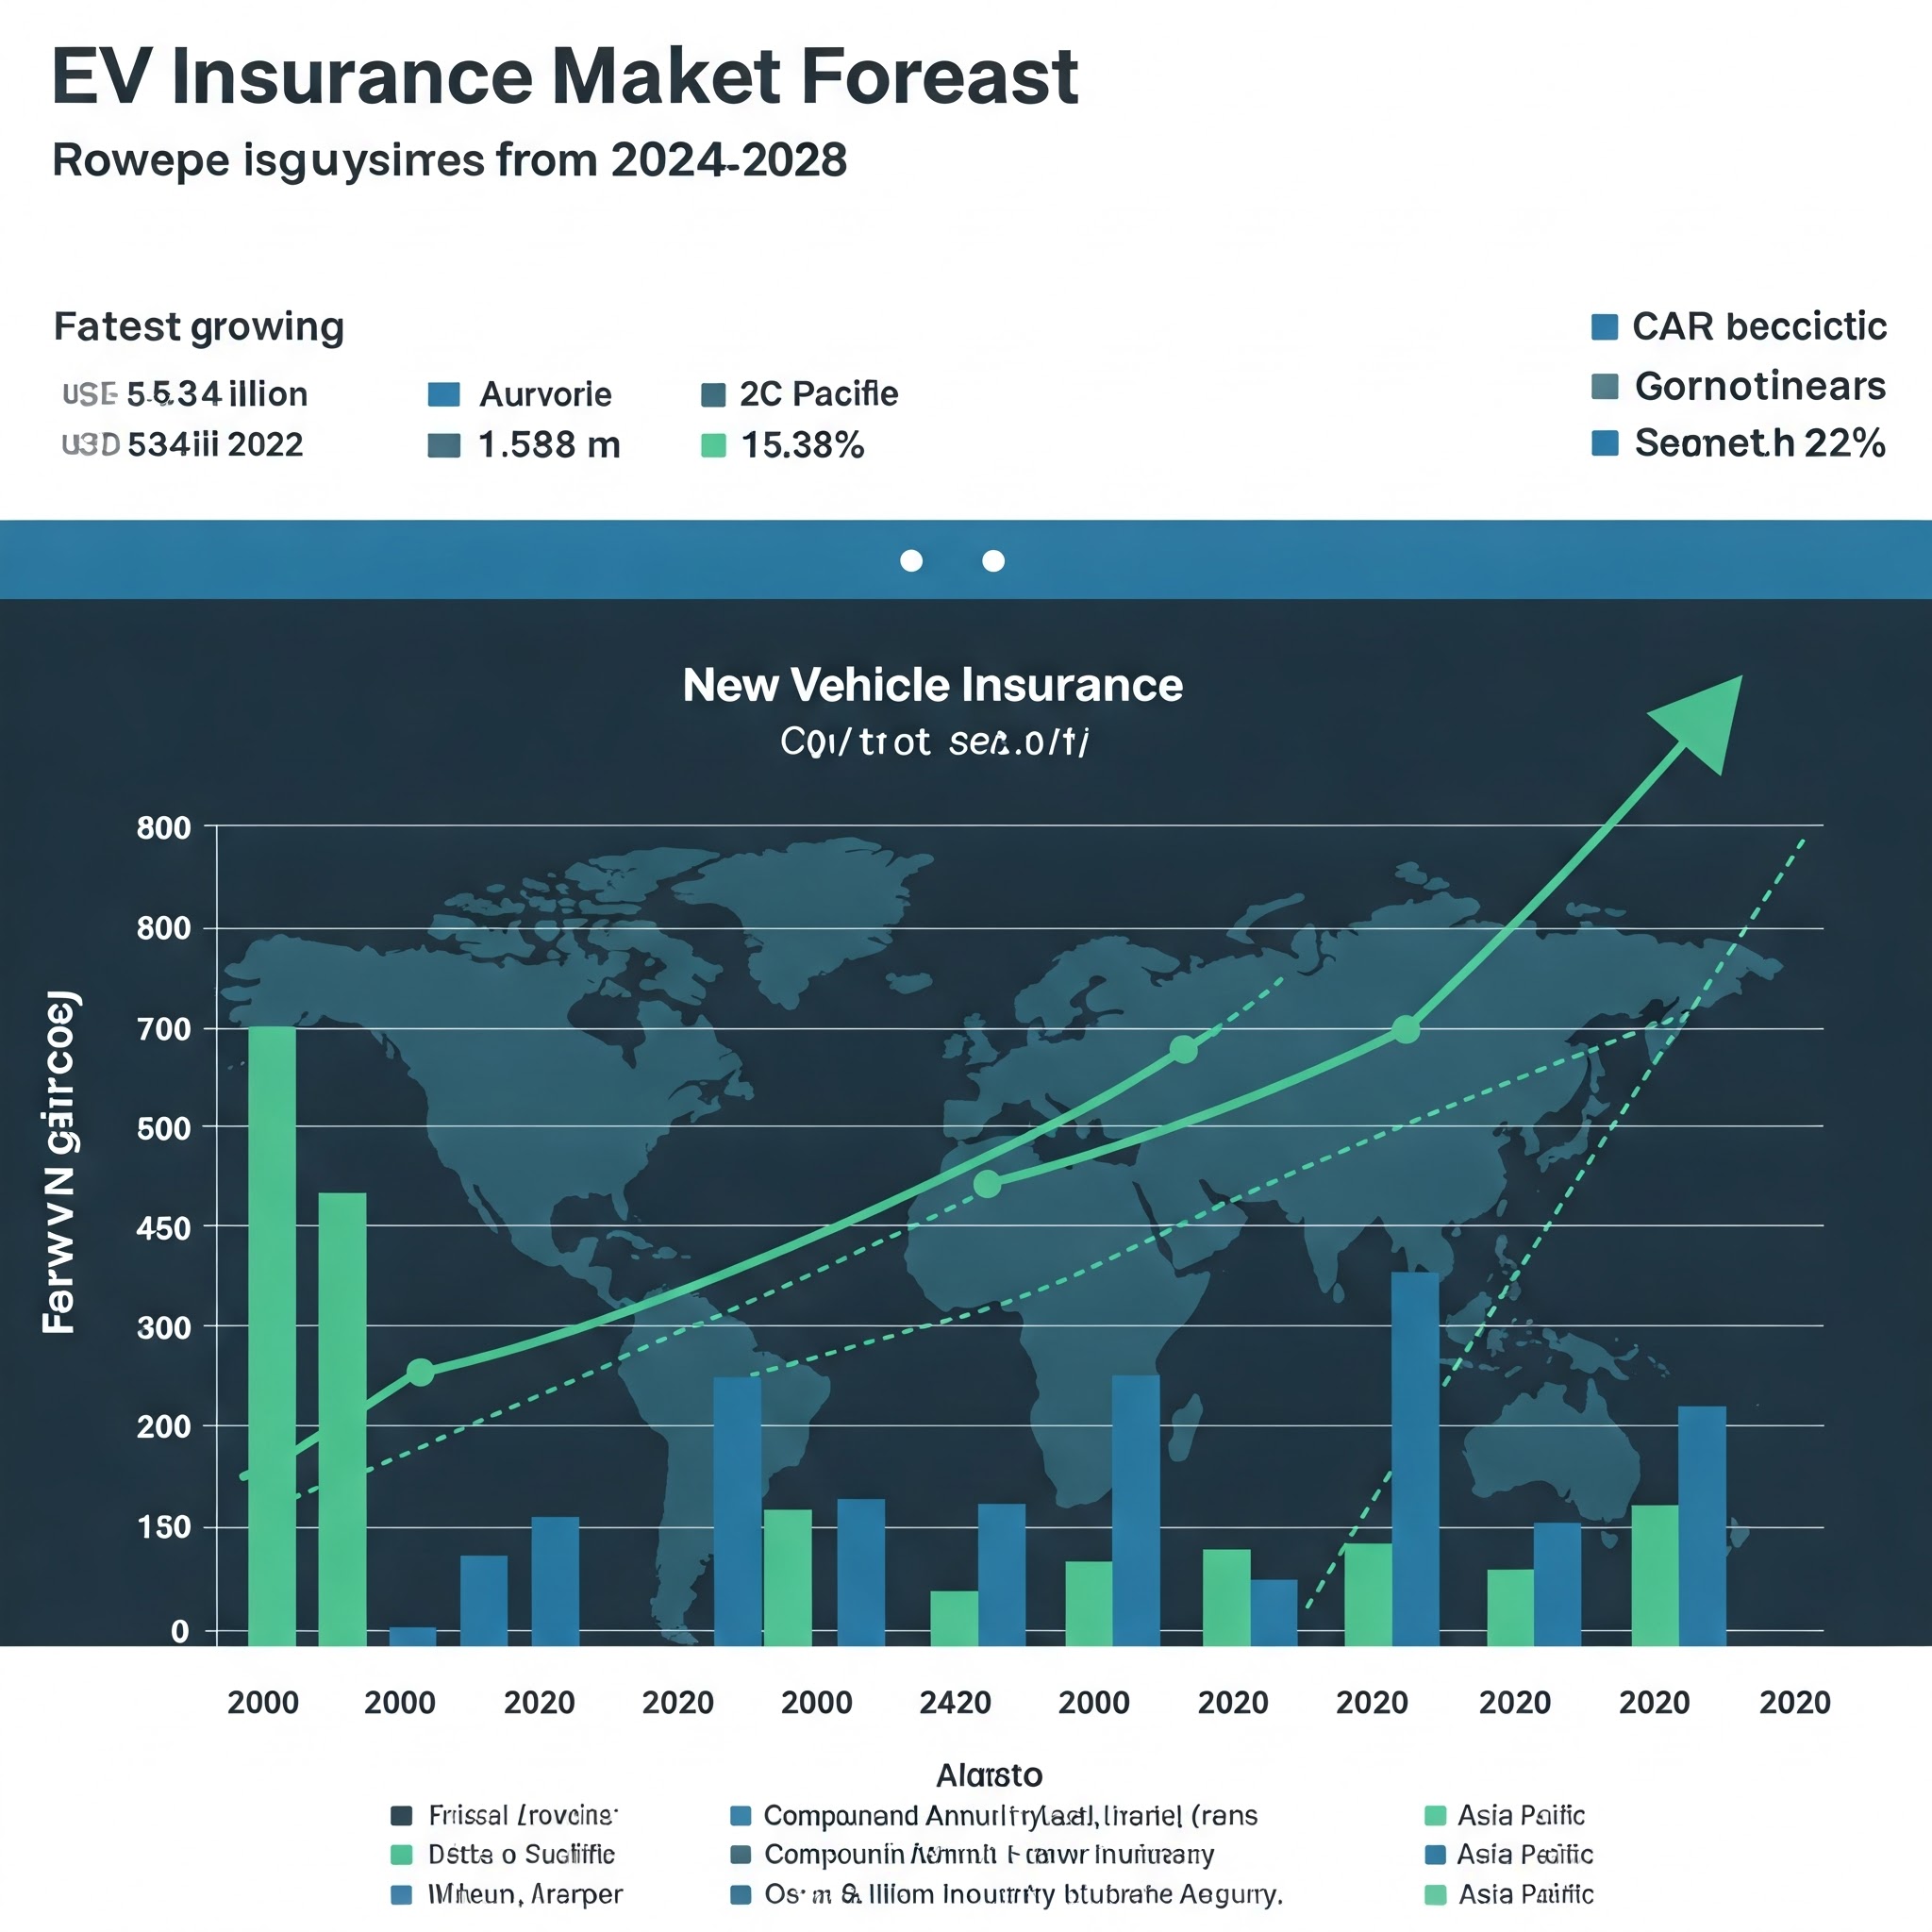
The global EV insurance market was valued at USD 53.34 billion in 2022 and is projected to grow at a CAGR of 15.38% from 2023 to 2028. As electric vehicle (EV) adoption rises worldwide, insurers are developing specialized policies that address unique risks, such as battery damage, charging infrastructure issues, and higher repair costs.
Market Trends
Personalized & Usage-Based Insurance (UBI): Insurers are leveraging telematics and AI to offer customized premium plans based on driving behavior.
Partnerships with Automakers & Charging Networks: Collaborations ensure seamless insurance integration at the point of EV purchase.
Battery Coverage & Warranty Extensions: Policies now include battery degradation protection and align with manufacturer warranties.
Incentives for Eco-Friendly Practices: Discounts for solar-powered home charging, eco-driving, and sustainable energy usage are gaining traction.
Expansion in Asia Pacific: With China, Japan, and South Korea leading EV adoption, insurers are rapidly scaling operations.
The EV insurance market is evolving rapidly with digital innovations, strategic partnerships, and specialized policies. With a CAGR of 15.38% through 2028, insurers are adapting to support the global transition to electric mobility.
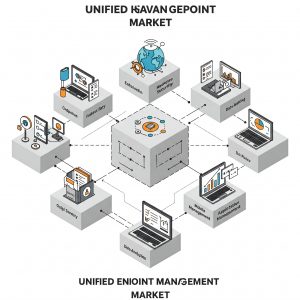
Unified Endpoint Management Market size was worth USD 5.5 billion in 2023 and is estimated to hold a CAGR of more than 18.6% from 2024 to 2032.
The growing presence of smartphones, tablets, laptops, and Internet of Things (IoT) in commercial environments complicates the management of all endpoints. The demand for Unified Endpoint Management (UEM) systems is driven by the centralized nature of managing devices. For example, as of the end of 2023, 5.6 billion individuals subscribed to mobile services and 4.7 billion individuals accessed mobile internet, reports the Global System for Mobile Communications (GSMA).
Unified Endpoint Management
Global unified endpoint management market report- Browse Insights-
Component, Deployment Type, Application, Operating System, and End User
Growth Drivers
Increasing complexity of endpoint ecosystems
Growing demand for cybersecurity and compliance
Growing remote work and BYOD policies
Proliferation of mobile devices
Pitfalls & Challenges
Complexity in managing diverse devices
Integration and interoperability challenges
Unified Endpoint Management Market Trends
UEM solutions are becoming more reliant on Machine Learning (ML) and AI to make repetitive tasks like patch management, device provisioning, and security enforcement automated. Such tools enable IT staff to manage operations and respond to threats better. For example, in June 2023, Syxsense introduced Syxsense Enterprise Suite, which provides patch and vulnerability management, MDM, zero trust, automation and orchestration features, and remediation.
BlackBerry UEM at the edge and BlackBerry UEM for the IoT. Integrating with AWS Local Zones and Availability Zones, the solution pushes the reach of BlackBerry’s patented secure connection architecture, the Network Operations Center (NOC), to the edge, allowing secure placement of compute, storage, and other services where data is being created and consumed.
Unified Endpoint Management Market Analysis Find out more about the major segments defining this market
Segment-wise, the market is categorized based on software and services. The software segment made a revenue of more than USD 4 billion in 2023. Software-based UEM solutions are gaining popularity as they provide easier scalability, greater accessibility, and lesser infrastructure costs. With software-based UEM platforms, companies are able to control endpoints from any location with internet access, which helps in remote working and improves productivity.
With solutions prioritizing self-service capabilities, personalized device configurations, and intuitive interfaces, user experience is becoming vital in UEM design. User-oriented UEM platforms streamline IT admin tasks while seeking to boost end-user productivity and satisfaction levels. Furthermore, end-to-end device lifecycle management, from provisioning and configuration through retirement and disposal, is increasingly becoming a feature of UEM platforms. By reducing manual effort and minimizing downtime, automated workflows streamline the process of device onboarding, updates, and decommissioning.
On the basis of deployment type, the unified endpoint management market is divided into cloud and on-premises. The double-digit growth of cloud segment is anticipated to maintain over USD 16 billion by 2032. Pricing models based on subscription are typical in cloud implementations, and they prove attractive to organizations attempting to steer clear of massive initial outlay in equipment and infrastructure. For example, as per the GSM Association, public cloud expenditure in December 2023 was USD 600 billion together with a boost in infrastructure-as-a-service.
Conversely, for companies with solid infrastructure and stable consumption patterns, on-premises installations might be more cost-effective in the long run while incurring higher initial costs. Some companies, particularly those operating in highly regulated industries like healthcare or finance, might need to use on-premises deployment owing to stringent security as well as compliance regulations. This provides enterprises with greater control over data governance and ensures compliance with industry regulations.
Unified Endpoint Management Market Share
IBM and Ivanti are the market leaders with approximately 7% market share. IBM’s flagship UEM platform, MaaS360, provides endpoint management and security for various types of devices such as wearables, IoT devices, laptops, desktops, tablets, and smartphones. Device enrollment, policy management, application management, content management, threat management, and identity management are just a few of the functions offered by MaaS360.
Organizations are able to manage multiple devices with Ivanti’s UEM platform, such as IoT devices, mobile devices (iOS, Android), and traditional desktops & laptops. It provides provisioning, configuration, monitoring, and security enforcement. In order to ensure that all endpoints managed are safe from threats, Ivanti provides robust patch management solutions that automate the discovery of finding, testing, and deploying updates on all of them.
Unified Endpoint Management Market Companies Major industry players in the UEM industry are
Broadcom
Blackberry Ltd.
Hexnode
IBM
Ivanti
Microsoft Corporation
Samsung KNOX
During May 2024, Microsoft released an update to its Intune Suite that included a new primary endpoint for remote assistance on Windows, web, and MacOS. The integration of the suite enabled the firm to scale the unified management solution offerings for diverse end users within a single offering.
Hexnode in November 2023 released integration with Vanta, a management platform, to make sure that fleets of connected devices are compliant with Vanta validating Hexnode’s assertion. Through the integration, Vanta is able to gather information on devices registered in Hexnode due to the integration with Hexnode UEM. Vanta determines the level of compliance and identifies potential risks based on the data collected. IT admins can initiate the required action through the Hexnode UEM portal to enhance security and comply with regulations by leveraging the insights from Vanta reports.
The ongoing innovations and convergence of technological breakthroughs like blockchain, Artificial Intelligence (AI) and Machine Learning (ML) in payment technology in the B2B and corporate payments space are anticipated to drive market growth. As there is a rise in digitization across industries, companies are implementing electronic payment solutions for speed, accuracy, and efficiency. Increased international trade and cross-border transactions are also playing a key role in boosting the demand for safe & efficient B2B payment solutions.
Payment, Solutions, Enterprise Size, Industry Vertical
Growth Drivers
Increasing adoption of digital payment solutions
Rise in technological advancements
Global trade expansion
Growing economies worldwide
Pitfalls & Challenges
Regulatory compliance
Cybersecurity risks
Corporate Flows B2B Payment Market Trends
There is a very fast evolution of the technology in the corporate and B2B payments segment. Technologies like Blockchain, Artificial Intelligence (AI) and Machine Learning (ML) are being used more and more for security, transparency and transaction efficiency, improved fraud detection, payment process automation, and predictive analytics for cash flow management. It is especially suitable for cross-border payments, providing security, quicker processing time, and lower costs. Application Programming Interfaces (APIs) are making it possible to integrate payment solutions with the current ERP and accounting systems seamlessly. This integration makes automation and real-time data exchange possible.
Increased utilization of digital money in B2B payments due to speed, stability, transparency, and reduced cost is also a trend observed. To save payment information from the growing vulnerability of cyber-attacks and cyber-frauds, companies are investing in better security solutions like multi-factor authentication, encryption, and tokenization. Payment systems integrated with smartphones offer convenience and flexibility. Due to the spread of the pandemic caused by the COVID-19 virus, there has been increased adoption of contactless solutions aimed at reducing human contact and ensuring efficiency in payment processes.
For example, in May 2024, Worldline, a payment service provider, partnered with Visa to introduce a new virtual card issuing solution to improve the efficiency and security of payments to address the unique needs of the fast-growing Online Travel Agency (OTA) segment. Today’s technology, including RegTech (Regulatory Technology), assists companies by streamlining compliance activities with the intricate regulatory environment.
Corporate Flows B2B Payment Market Share
Visa, Mastercard, Citigroup control the corporate flows B2B payment market with more than 8% market share, offering a suite of solutions addressing the changing business requirements. Visa provides solutions like Visa Business Solutions, Visa B2B Connect, and Data Solutions to make faster business payments simpler & safer, enhance cash flow, facilitate financial engagement & enable businesses to better understand their payment flows, optimize cash management, and enhance financial decision-making.
Mastercard provides solutions like Mastercard Commercial Solutions and Mastercard Track with sophisticated features like spending controls, comprehensive transaction reporting, financial system integration, supply chain finance, increased data transparency, and streamlined payment processing.
These players are sustained in their dominance by continually innovative technologies, increasing global reach, and meeting varied industry requirements. Their brand built reputation, customer confidence, and adherence to serving changing customer engagement needs consolidate their position, defining the landscape and determining the direction of the changing market.
Corporate Flows B2B Payment Market Companies
Major players operating in the corporate flows B2B payment industry are
The size of the global digital avatar market was estimated to be USD 18.19 billion in 2023 and is expected to expand at a CAGR of 49.8% during 2024-2030. The trend of technological developments, such as high-definition graphics, augmented reality (AR), virtual reality (VR), and artificial intelligence (AI), is having a deep impact on the market scenario. These technologies play a vital role in making digital avatars more and more realistic and lifelike. As a result, avatars now have the capability to replicate human expressions and activities with great similarity. This practice is highly refining user experiences across different industries including gaming, entertainment, education, and communication and is leading the market to develop and grow further.
Report Attribute
Details
Base Year
2023
AI Avatars Market Size in 2023
USD 5.9 Billion
Forecast Period
2024 – 2032
Forecast Period 2024 – 2032 CAGR
30%
2032 Value Projection
USD 57.9 Billion
Historical Data for
2021 – 2023
No. of Pages
240
Tables, Charts & Figures
360
Segments covered
Avatar, Deployment, Technology, Application and Industry Vertical
AI Avatars Market Trends
The AI avatars market is seeing dynamic changes because of the development of numerous features like multimodal communication, making use of numerous AI and ML tools. Avatars are learning to interpret voice commands, face expressions, and gestures to become more aware of the user’s query and react in a better manner, therefore enhancing their interaction.
Most educational institutions are investing in AI avatar technology to offer a better learning experience to students. These avatars are able to offer customized learning experiences to the students and allow them to learn at their own pace, thereby making them comprehend the topics more efficiently. Moreover, this can also offer an interactive learning environment to the students, thereby improving their learning experience.
For example, in March 2024, a virtual reality platform called Villa was utilized by more than 700,000 individuals across the globe. The platform is introducing an AI avatar assistant with remarkable features to educate users and navigate them through the virtual world. Students can acquire new languages, learn lessons, learn skills, and receive assistance in answering complex questions through the AI assistant, in more than 30 languages.
AI Avatars Market Share
NVIDIA, Microsoft, and Google are leading players in the AI avatar market with over 18% market share, drawn by their immense technological knowledge and resources. They rule the market through a mix of innovation, strategic alliances, and strong infrastructure. These companies invest significantly in research and development to continually push the boundaries of AI technologies, always remaining in the lead in the market.
Also, these giants leverage cloud computing platforms to offer scalable solutions, improving accessibility and integration across different applications. Their international presence and wide networks allow them to capture multiple markets, promoting mass adoption of their AI avatar technologies. Partnerships with other technology companies and educational institutions further support their positions, pushing the advancement of more advanced and effective AI avatar systems.
AI Avatars Market Companies
Major players operating in the AI avatars industry are
NVIDIA
Microsoft
Meta
Google
IBM
Anthropic
C3 AI
DataRobot
Databricks
Deep North
UiPath
Major Digital Avatar Firm Insights
The major firms in the industry are Epic Games, Inc.; NVIDIA Corporation; and Microsoft.
Epic Games Inc’s pairing of innovative technology, hit game products, metaverse projects, strategic alliances, and continuous innovation makes it one of the industry leaders in setting the direction for the market’s future. By projects such as the Fortnite metaverse and with other firms involved in metaverse development, Epic Games is the leader in directing the future of digital avatars in immersive virtual worlds.
NVIDIA Corporation, which is popular for its graphics processing units (GPUs) for gaming and professional markets, has now ventured into digital avatars and artificial intelligence (AI) technologies. With its expertise in graphics, AI, and computing, the company is pioneering in creating digital avatars, improving animation, and improving interactive experiences.
Pinscreen Inc.; Soul Machines; and UneeQ are a few of the new players in the market for digital avatars.
Pinscreen Inc. is a tech firm that deals in the creation of sophisticated computer vision and AI technology, mainly focused on digital avatars and virtual humans. The company’s proprietary technology enables people to develop extremely realistic and customizable digital avatars based on a single photo or video. The avatars can be used for an array of purposes such as virtual communication, games, virtual try-on experiences for online shopping, and digital entertainment.
Soul Machines is a tech firm recognized for its work on realistic digital avatars and virtual assistants. It has expertise in the production of emotionally aware, interactive AI-enabled avatars mimicking humanlike facial expressions and actions. Avatars created by Soul Machines have been used for offering rich, personalized customer engagement across a spectrum of sectors ranging from customer support, health care, and financial institutions to media and entertainment.
The MPOS Terminals Market is forecasted to grow at a CAGR of 12.73% during the 2025-2030 forecast period to reach USD 90.83 billion by 2030, from an estimated USD 49.89 billion in 2025.
The mobile POS or mPOS terminals or market refers to the mobile devices that are used to execute transactions, including tablets or smartphones and dedicated payment devices, to process payments at the point of sale. In that regard, the payment could be made through the scanning of a QR code, debit and credit cards, cash, or UPI transfers. These mPOS systems allow businesses to receive payments in various forms easily, thus making it convenient for customers to pay. Because these systems are able to process all the modes of payments as well as monitor the transactions, they reduce the total cost and enhance efficiency.
Mobile POS solutions are increasingly gaining ground since they enable sales and services businesses to process the transaction from the client’s site, infusing more flexibility into the entire process as well as enhancing the customer experience.
High smartphone penetration and improved internet connectivity
The growth of e-commerce and the need for seamless omnichannel retail experiences
Expansion of digital wallets and fintech services
Government initiatives and regulations for adoption of digital payments
Pitfalls & Challenges
Security vulnerabilities
Technical issues and reliabilit
The increased online shopping business in the world as well as the intertwining of physical stores and internet business practices are also anticipated to impact future terminal growth. Actually, the availability of cash on delivery as an option through leading e-commerce websites has brought about a steep rise in mobile POS terminal adoption. Security protection is a prime concern since mPOS devices will not necessarily offer security measures as strong as POS devices, particularly if commercial-off-the-shelf (COTS) devices like Apple or Android smartphones and tablets are used.
In the latter part of the forecast period, the market is expected to expand as vends enhance their applicable offerings in accordance with growing demand for contactless convenience payments. Since mPOS solutions are especially tailored for handheld devices rather than desktop computers, the pattern of lighter and more portable devices will boost the growth of the market.
mPOS Terminals Market Trends Increase in Adoption of Card and Online payment
The growth of fintech companies and digital-only banks is anticipated to increase competition in the global banking industry and increase the use of debit cards.
In the US, where credit cards are so common, individuals in areas like Latin America, especially those from lower-income backgrounds, have always made payments in cash. In recent years, however, there has been a shift in these areas too, and more individuals are getting accustomed to making payments using credit cards as digital adoption increases. The point-of-sale card payments globally consist of debit cards, credit cards, and prepaid cards financed by banks. In the last several years, debit card point-of-sale card-payment transactions and credit card point-of-sale card-payment transactions are becoming increasingly popular in all the regions. The rise in card payments at the point of sale is mainly bolstered by a number of initiatives taken by the government, which include capping interchange fees and the extensive rollout of POS infrastructure.
In June 2023, Tap to Pay on iPhone offers a simple, secure, and private method of taking in-person contactless payments at LVMH stores with iPhone – no extra hardware required.
LVMH made the announcement during this year’s Viva Technology show that it will start deploying Tap to Pay on iPhone to certain LVMH Group stores in the U.S. later this year, delivering a smooth and secure payment experience. Through Tap to Pay on iPhone, LVMH Group client advisors can accept Apple Pay, contactless debit and credit cards, and other digital wallets in the shop by simply employing their iPhone and a partner-approved iOS app – no extra hardware required, with or without any purchase amount. Australia has also seen an uptick in the number of EFTPOS terminals over the last two years.
A higher number of airports throughout the nation, since it has been established to be the secure mode of payment, it is likely to enhance card payment acceptance at the retail outlets in the nation. For example, in November 2021, In a bid to increase payments competition within the Digital Economy of Australia, EFTPOS announced that the latest phase of its next-generation digital security technology had become operational with many banks in Australia merchants and FinTechs, including Fat Zebra, Till Payments, and EFTEX. Additionally, with more economic sectors being opened, numerous POS companies worldwide are ramping up their production to meet the demand for the POS system at different physical locations. Such progress is expected to further boost card-based payment growth over the period of study.
mPOS Terminal Market Share
Ingenico Group, VeriFone Systems, Inc., and Square, Inc. lead the market with approximately 10% market share. Square, Inc. is famous for its end-to-end suite of financial services and cutting-edge payment solutions. Square first gained momentum with Square Reader, a small, compact card reader that converted smartphones and tablets into payment terminals. Since then, Square has diversified its product offerings to encompass a series of mPOS devices like the Square Terminal and Square Register, targeting mainly small and medium enterprises (SMBs) from diverse industries like retail, food services, and professional services.
VeriFone Systems, Inc. has been providing secure electronic payment solutions. With expertise in hardware-based mPOS terminals and payment processing solutions, VeriFone caters to a worldwide customer base across retail, hospitality, transportation, and financial services sectors. VeriFone provides a comprehensive portfolio of mPOS products ranging from countertop terminals, mobile terminals, and integrated POS systems that can handle multiple payment methods like EMV chip cards, contactless payments, and mobile wallets. VeriFone is known for its strong security features and adherence to industry standards such as PCI-DSS.
mPOS Terminal Market Companies Key players in the mPOS terminal market are
Diebold Nixdorf
Epicor Software Corporation
Ingenico Group
Micros Systems, Inc.
NCR Corporation
NEC Corporation
Panasonic Corporation
PAX Technology
Square, Inc.
VeriFone Systems, Inc.
mPOS Terminal Industry News
In May 2024, VeriFone launched an all-in-one mPOS terminal with improved security features. It showcased its recent product offerings and improvements in security features. It seeks to deliver secure and user-friendly payment options that suit modern businesses and customers.
In April 2024, to further strengthen the omnichannel retailing experience, Square introduced new features that connect its mPOS devices with leading e-commerce platforms such as WooCommerce and Magento. It enables merchants to track both online and in-store sales through one interface and mPOS devices offering flexible and mobile payment solutions that can be integrated with e-commerce platforms.
Sustainable FinanceMarket size was USD 5.4 trillion in 2023 and is anticipated to record a CAGR of more than 22% during the forecast period of 2024-2032, led by increasing awareness among people and governments about environmental and social concerns.
Across the world, governments are increasing their efforts to encourage sustainable financing. The driving force for these efforts arises from increased awareness of social and environmental issues, and an appreciation for the central role that finance can play in meeting objectives of sustainable development.
For example, in September 2023, Singapore and China set up a new green finance taskforce to enhance their bilateral collaboration in green and transition finance. The taskforce, referred to as the China-Singapore Green Finance Taskforce (GFTF), will work to intensify cooperation between the two nations and promote increased public-private sector involvement in sustainable finance activities.
Investment Type, Transaction Type, Investor Type, and End-use
Growth Drivers
Growing awareness about environmental and social issues
Increasing government and public awareness towards sustainability
Growing sustainability regulations globally
Rising focus of businesses towards enhancing their goodwill
Pitfalls & Challenges
Diversification issues of sustainable finance
Evolving regulatory environment
Sustainable finance Market Trends
With more advanced data analysis, greater transparency, and simplified access to ESG data, fintech developments are transforming sustainable finance. Supply chain finance becomes more transparent with blockchain technology and enhances the trackability of sustainable investments. Impact indicators can be assessed, ESG criteria can be screened, and stakeholders can be engaged by investors more effectively with the aid of digital tools and platforms.
Funding climate change projects is essential to reduce its impact and transition to a low-carbon economy. Financing carbon reduction initiatives, climate-resilient infrastructure, renewable energy projects, and adaptation strategies is being mobilized by financial institutions. Addressing and managing climate risks within investment portfolios is increasingly depending on scenario analysis and climate-related financial reporting.
Sustainable finance Market Analysis
Investing is becoming greener! Today, there are various kinds of investments that prioritize various aspects of sustainability, such as the environment, social factors, and general responsible investing. Green bonds are a significant portion of this, accounting for more than a third of the market in 2023. They’re utilized specifically to finance projects that benefit the environment, such as constructing sustainable buildings, conserving water sources, and assisting wildlife. Green bonds have grown even more popular and innovative over the last few years. Green bond-issuing companies began including more and different kinds of projects, such as sustainable buildings, flood management, and adaptation to climate, in their offers. Banks and financial institutions facilitate making green bonds a reality through deal structuring and product formulation catering to investor demand. And if you need to invest on the path of creating a greener future, then green bonds and other eco-conscious investments deserve consideration.
Green finance is being driven by governments and regulatory bodies across the globe through policies, incentives, and frameworks. For example, the EU Green Bond Standard has set out well-defined rules and requirements on what a green bond is. This puts pressure on issuers to adhere to green finance standards and reveal information about the environmental performance of financed projects, hence leading to investment.
Sustainable Finance Market Companies
Key companies that operate in the sustainable finance sector are
Blackrock
HSBC Group
Deutsche Bank AG
Goldman Sachs
BNP Paribas
UBS
Bank of America
Sustainable Finance Industry News
Indosuez Funds issued Chronos Green Bonds 2028, a fixed-maturity fund that invests in green bonds of companies that are engaged in the process of adopting initiatives that are aligned with the United Nations’ Sustainable Development Goals, in June 2024. The fund is an Article 9 fund under the EU’s Sustainable Finance Disclosure Regulation (SFDR) and has a conservative risk profile that guarantees returns with a moderate risk.
During January 2024, State Bank of India raised USD 250 million by issuing green bonds, which will be due in December 2028. The net proceeds of the green bond issue will be used to finance eligible green projects under SBI’s ESG Financing Framework. This is consistent with SBI’s sustainable development strategy and promoting a favorable environmental impact.
The market research report on sustainable finance contains comprehensive coverage of industry with estimates & forecast in revenue ($Bn) terms from 2021 to 2035, of the following segments
Market, By Investment Type
Equity
Fixed income
Mixed allocation
Others
Market, By Transaction Type
Green bond
Social bond
Mixed-sustainability bond
ESG integrated investment funds
Others
Market, By Investor Type
Institutional investor
Retail investor
Market, By End-use
Utilities
Transport & logistics
Chemicals
Food & beverages
Government
Others
Regional Insights
The North America sustainable finance market is anticipated to exhibit a significant CAGR over the forecast period. Growing regulatory support and increased environmental awareness among consumers and investors are responsible for the growth of the market. The financial institutions in the region are quickly innovating to address the growing demand for sustainable investment products, including green bonds and sustainability-linked loans. This is supported by government policies aimed at ensuring sustainability, which have provided a supporting environment for sustainable finance. Due to this, North America will continue to follow a strong growth path, with forecasts pointing toward a continued increase in sustainable investments in the following years
U.S. Sustainable Finance Market Trends
The U.S. sustainable finance industry was in the leading position in 2024. The U.S. is experiencing a movement toward sustainable investment strategies, and large institutional investors, asset managers, and pension funds are making ESG considerations a top priority in their portfolios. The U.S. experienced growing demand for sustainable investment opportunities that meet the values and ethics of an individual. Banks are reacting by expanding their products to encompass other innovative financial instruments that meet this need. Additionally, regulatory policies are increasingly accommodative of sustainable finance activities, further propelling market expansion and drawing in more investors.
Europe Sustainable Finance Market Trends
The European sustainable finance sector was the biggest with 38.39% in 2024. The region has seen robust government support and regulatory policies that encourage sustainable finance activities. European nations have put in place numerous policies and regulations that compel financial institutions to integrate ESG considerations into investment decisions. The action plan of the European Union for sustainable finance has been instrumental in propelling sustainable finance growth with the establishment of clear standards and guidelines for sustainable investment products.
Asia Pacific Sustainable Finance Market Trends
The Asia Pacific sustainable finance industry is expected to expand at a CAGR of 27.3% in the forecast period. There has been an increased awareness among the governments and business communities in the region regarding the significance of sustainable development and confronting environmental and social issues. Governments in China, Japan, and South Korea have introduced ambitious sustainability targets and projects, providing a favorable environment for sustainable finance. In addition, there is growing awareness and demand for sustainable investment products among Asia Pacific investors.
China sustainable finance market is anticipated to grow at the highest growth rate in the forecast period. China is fast becoming a key player in the global sustainable finance market, fueled by government support of green finance and environmental sustainability. In addition, investment in green technologies and renewable energy projects is accelerating as the public and private sectors identify the need to align financial activities with sustainability objectives, thus driving the market growth.
The Japan sustainable finance market had a significant market share in 2024 and is transforming as investors and consumers become increasingly aware of environmental concerns. The government of Japan has been aggressive in adopting policies that promote sustainable investments, which has resulted in greater interest in green bonds and other environmentally oriented financial products.

 https://www.marketinsightsresearch.com/request/download/9/56241/Liability-Insurance-Carriers-Market